Hello, in this article we will see how to inventory our resources using the Resource Graph Explorer service. This is very useful for us when we have multiple resources and we want in a simple way by using queries (KQL) to visualize the resources of one or several subscriptions.
Prerequisite:
A Microsoft Azure subscription.
Disclaimer: Due to the constant updating of Cloud Computing technologies some steps may be different when reading the article, I will make the effort to keep it updated, but there could be some differences between what is shown below and the Azure console at the time of the implementation.
Working with Resource Graph Explorer
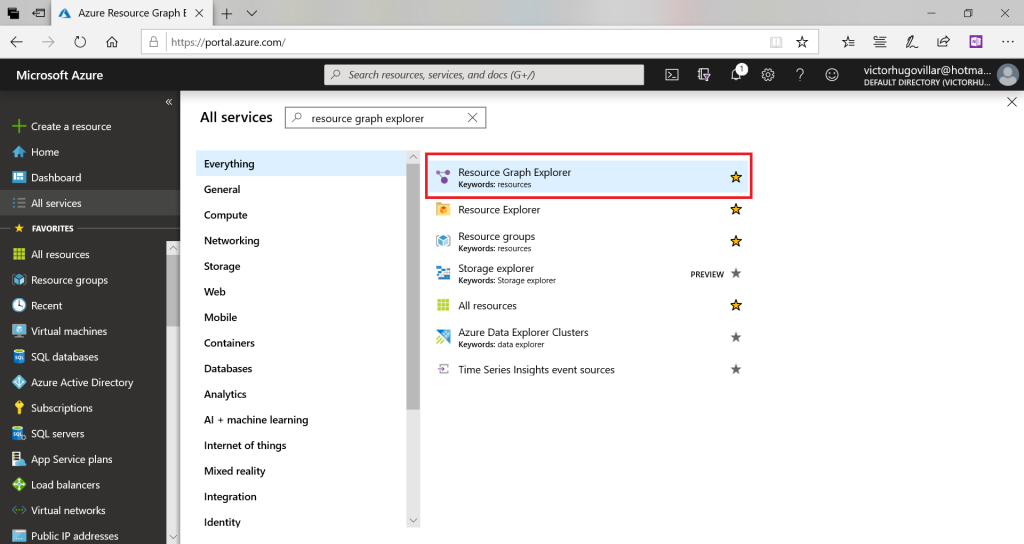
- Enter https://portal.azure.com, once inside go to all All Services and type Resource Graph Explorer
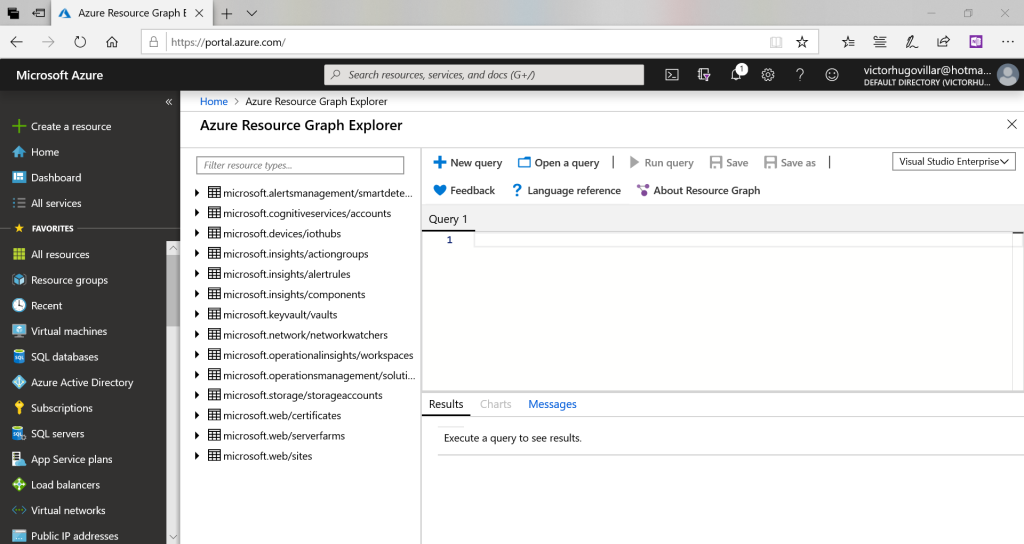
- There we see an interface with tables on the left side and in the middle a window in which we can type queries.
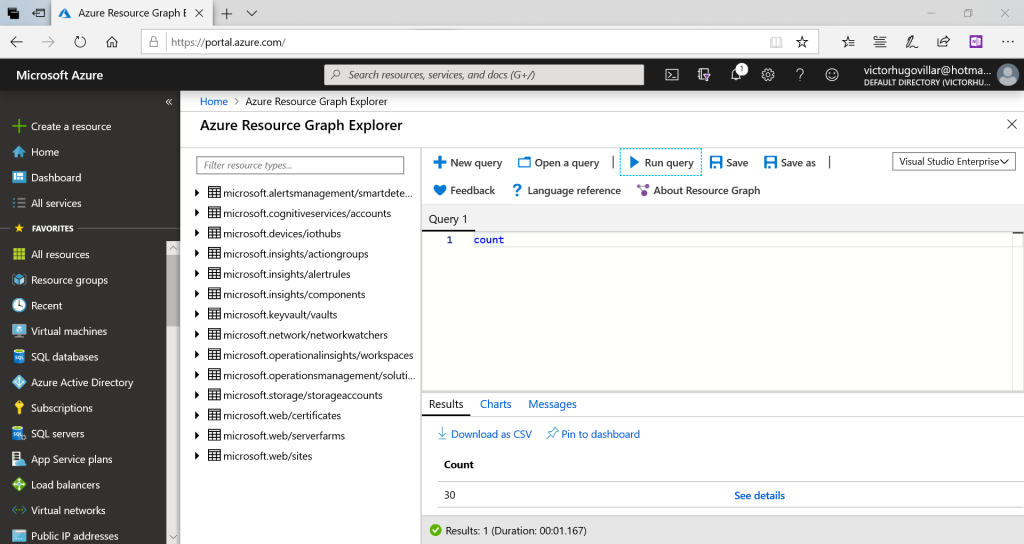
- Type
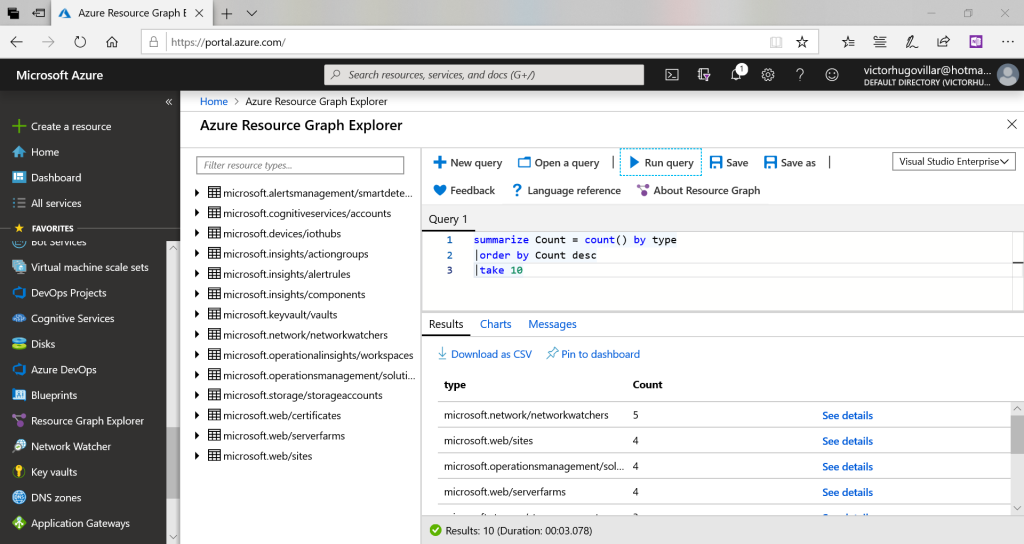
countand then click on Run query, this will indicate the amount of resources we have. - If we want to have a resource count by resource type we can use the query:
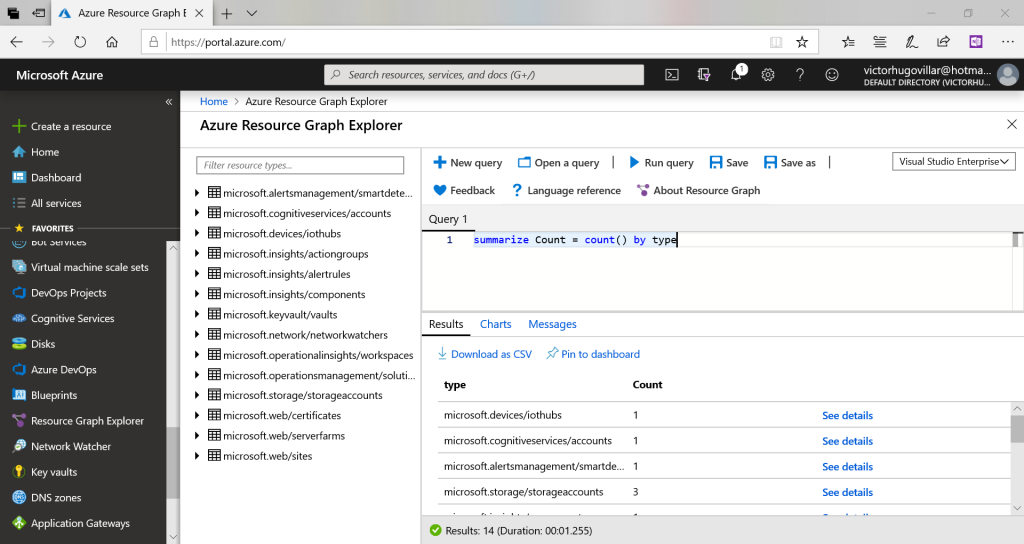
summarize Count = count () by type - If we want to sort it down and take the first 10 we can use the following query:
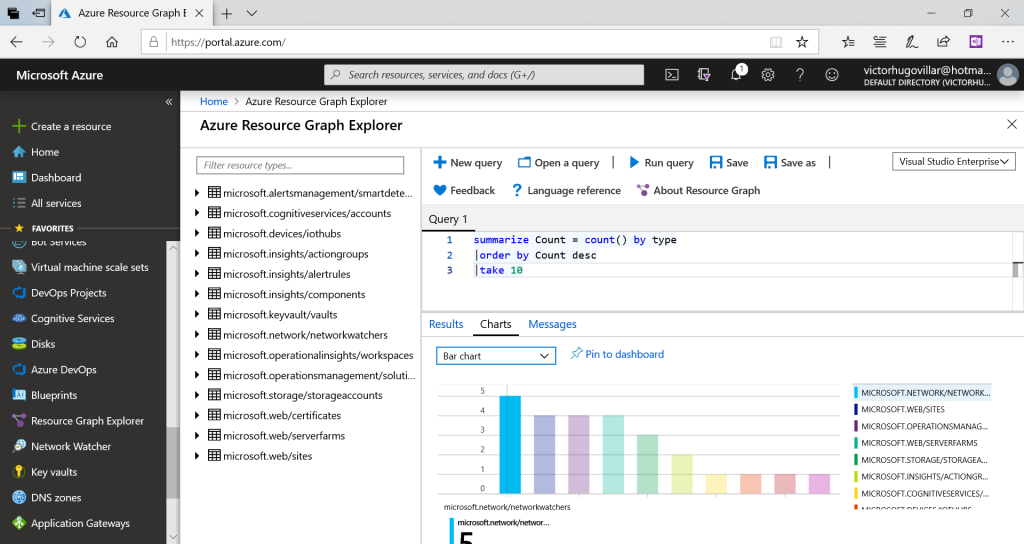
summarize Count = count() by type|order by Count desc|take 10 - In case we do not want to see them as a table but in a graphical way by clicking on Charts and selecting bar chart we can see it as a bar chart
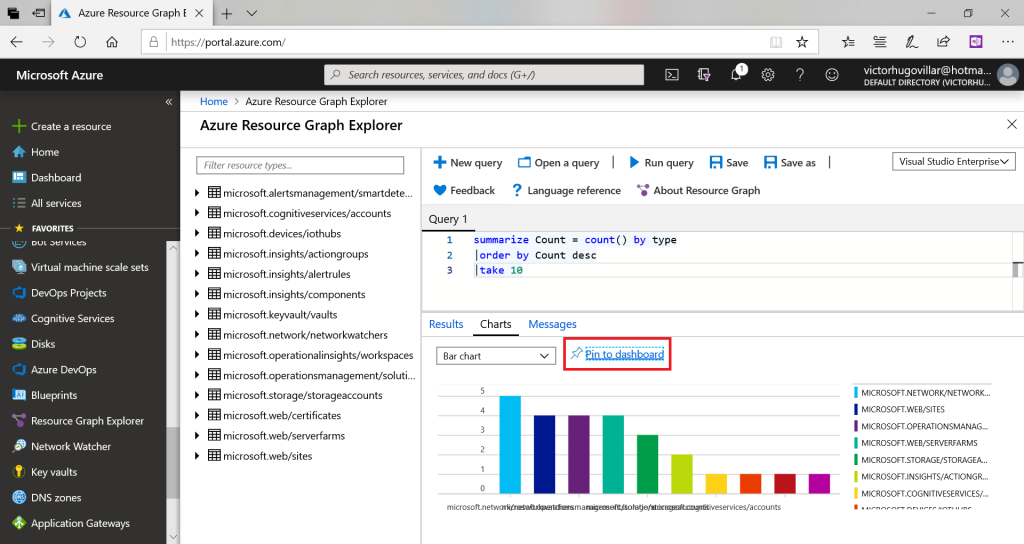
- Once we have the bar chart we will pin it to a portal panel by clicking on Pin to dashboard
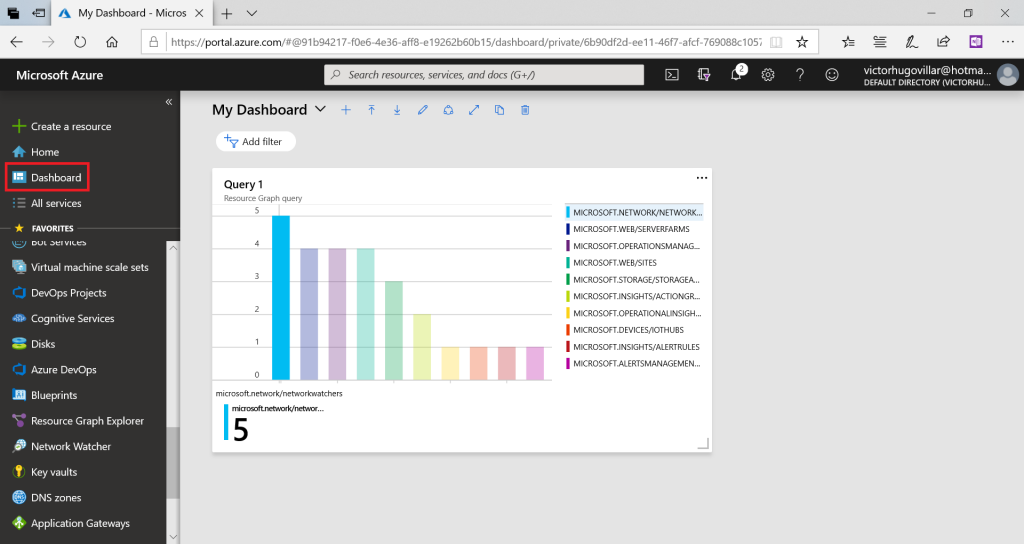
- If we go to Dashboard now we will see the bar chart.
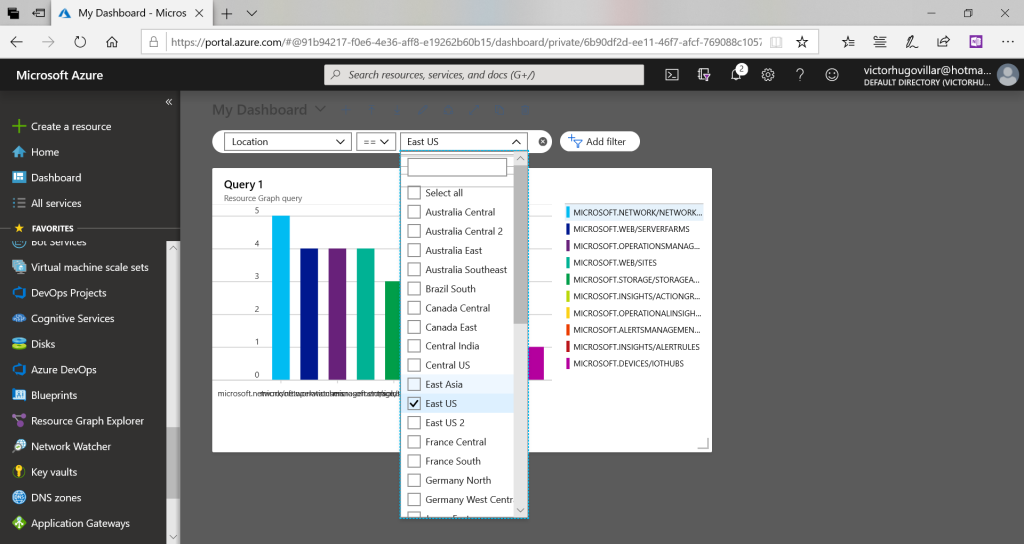
- At the top we have the option to apply filters, for example if we want to filter by region we can click on Add filter, then select Location and choose East US